
One platform for 24 biogas plants.
An operations platform for a renewable energy company running 24 biogas power plants. Operators log daily readings once, and management sees live fleet performance, SLA compliance and revenue.
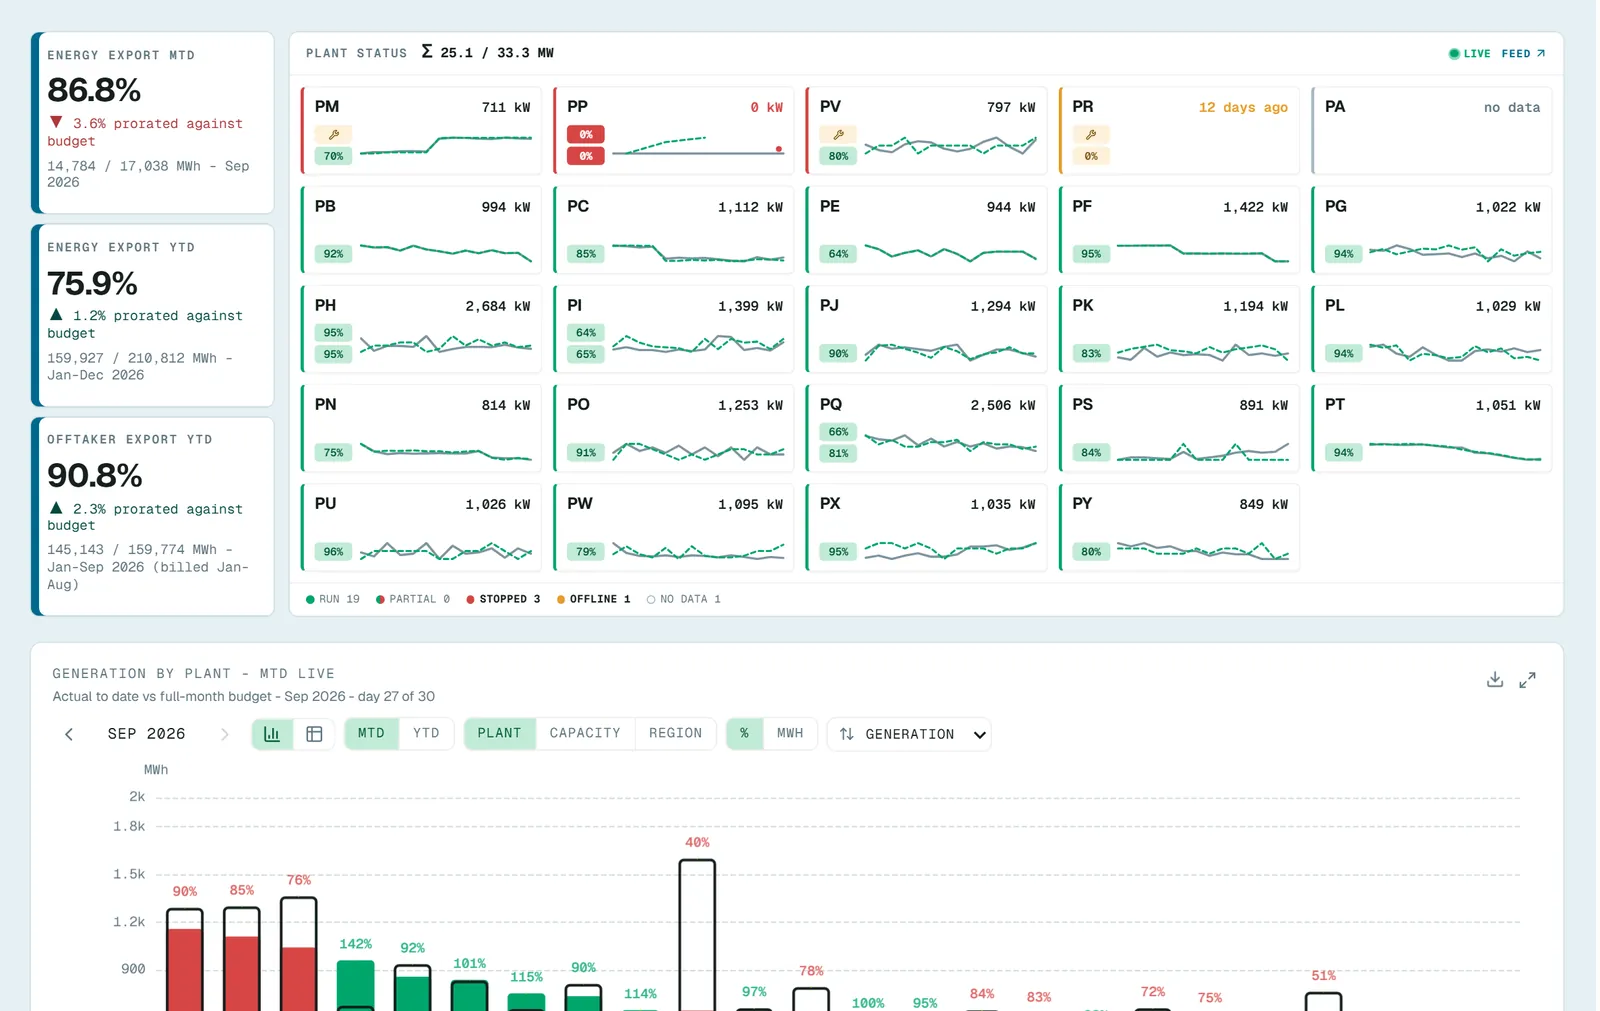
24 plants on fractured spreadsheets
The company tracked operations in fractured spreadsheets. Monthly reporting meant hours of manual compilation.
Downtime had no central record, and head office had limited visibility across sites.
Entered once at the plant, used everywhere
An operator logs the day's generation, feedstock and maintenance at the plant. SCADA data arrives around the clock, and when an engine goes down a push notification reaches the team. At month end, the report generates in about ten minutes.
What we built
Operator portal
Operators log daily generation, feedstock and maintenance. Entered once, used everywhere.
Live SCADA ingestion
The fleet dashboard reflects each plant in near real time.
Downtime logging
Cause classification, overlap protection, and running hours auto-filled from SCADA.
Automated monthly reports
What took around six hours of compilation now generates in about ten minutes.
Role-based access
Each operator sees their plant, while management sees the fleet.
Maintenance, spare parts and calibration
Modules with full history per asset.
Are we on budget, and why not?
The data the plants log feeds a monitoring layer for management. Swipe or use the arrows; the card in the middle explains its method. Real screens, plant names masked.
-
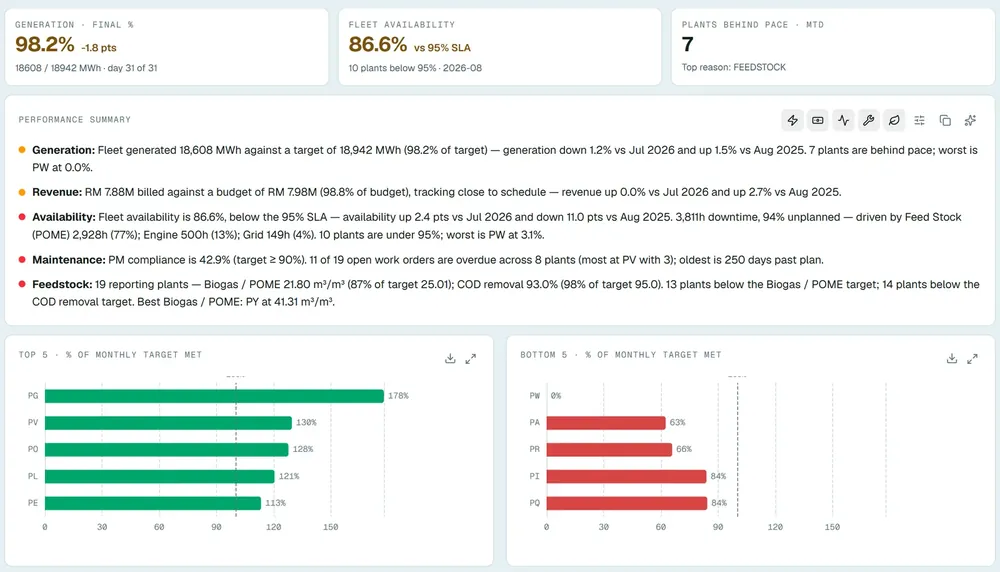
A written summary of the month
- Method
- Rule-based narrative over KPIs, with month-on-month and year-on-year deltas
- Problem
- Managers read five dashboards to learn one thing: what went wrong this month.
- Solution
- Five sentences written from the data every month, one each for generation, revenue, availability, maintenance and feedstock, each naming its comparison and worst plant.
-
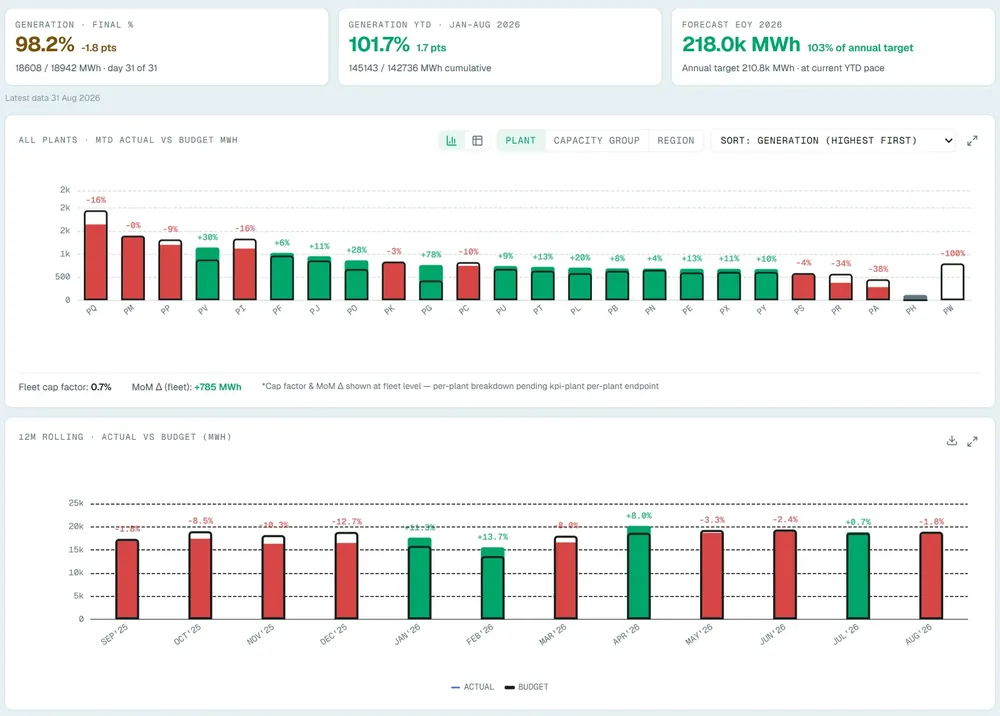
Generation against budget
- Method
- Variance to budget per plant, rolling 12 months, year-end forecast at current pace
- Problem
- Budget misses surfaced at the quarterly review, too late to recover.
- Solution
- Every plant's actual against budget with the variance on each bar, a rolling 12-month view and a year-end forecast.
-
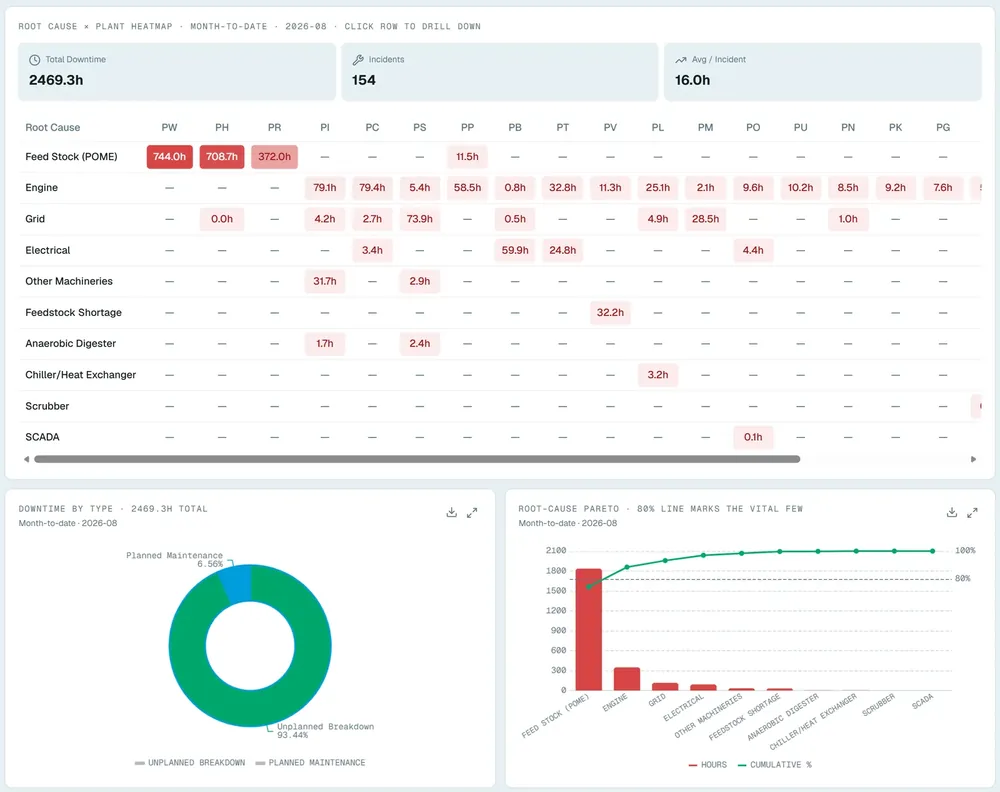
Why we lost hours
- Method
- Root cause by plant heatmap, Pareto with an 80% line
- Problem
- Downtime was a long list of incidents with no visible pattern.
- Solution
- Lost hours by cause and plant in one grid, and a Pareto that shows the few causes behind most of the lost hours.
-
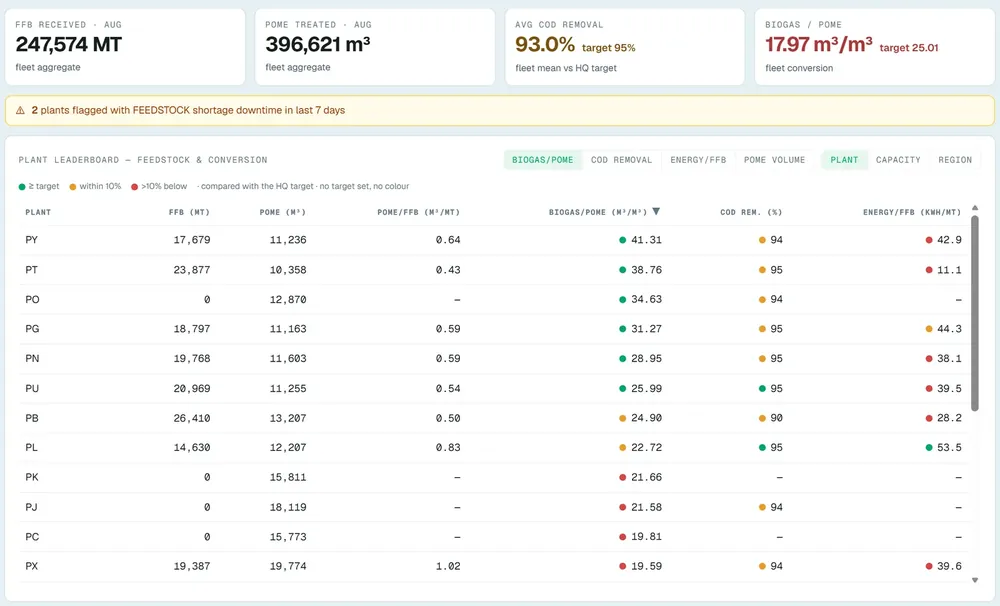
Feedstock conversion
- Method
- Benchmarking against HQ targets with traffic-light bands
- Problem
- Plants were ranked on output alone, which hides how well each one turns feedstock into gas.
- Solution
- A leaderboard of biogas per m³ of POME, COD removal and energy per tonne of fruit, each banded against target.
-
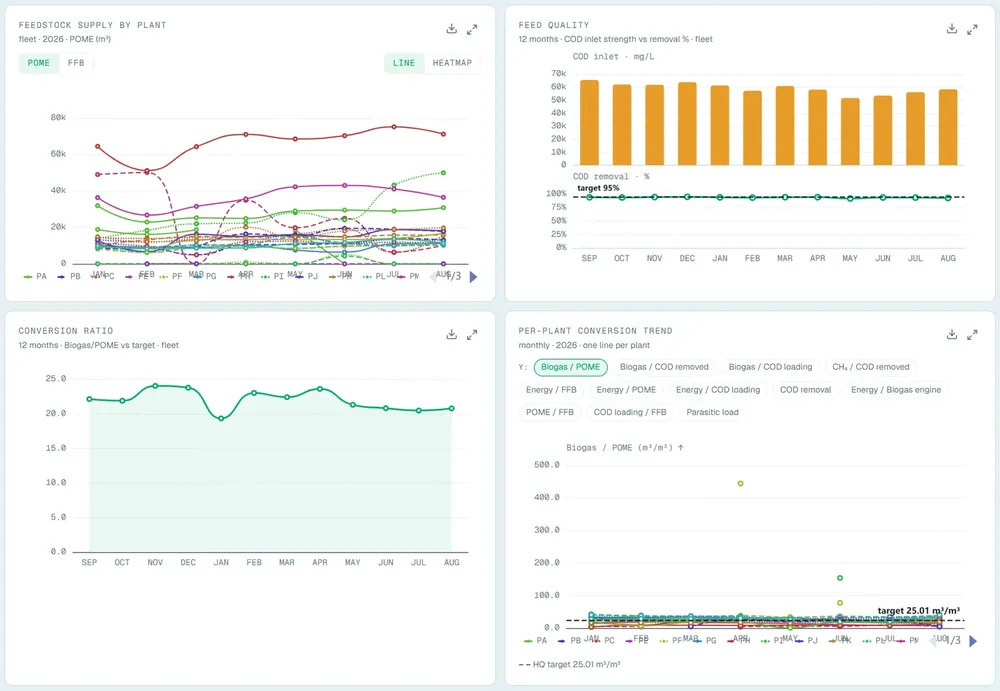
Feedstock trends
- Method
- 12-month supply, feed quality against removal, per-plant conversion lines
- Problem
- A falling conversion ratio went unnoticed until output dropped.
- Solution
- Feed supply, feed strength against removal, and conversion per plant over twelve months, so a drift is visible before output falls.
-
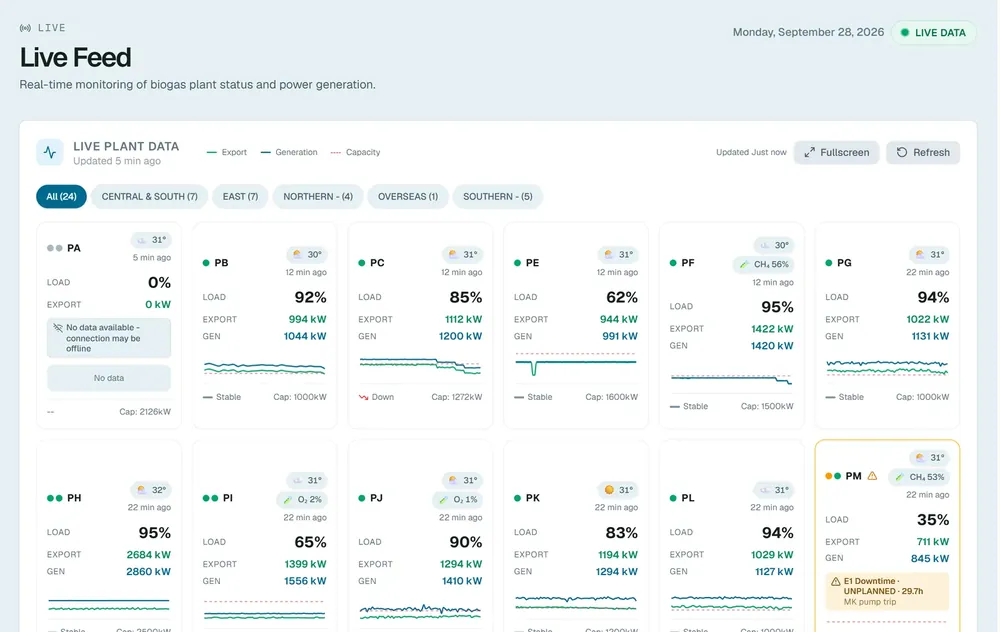
Live SCADA feed
- Solution
- Load, export, gas quality and weather for every plant, refreshed live.
-
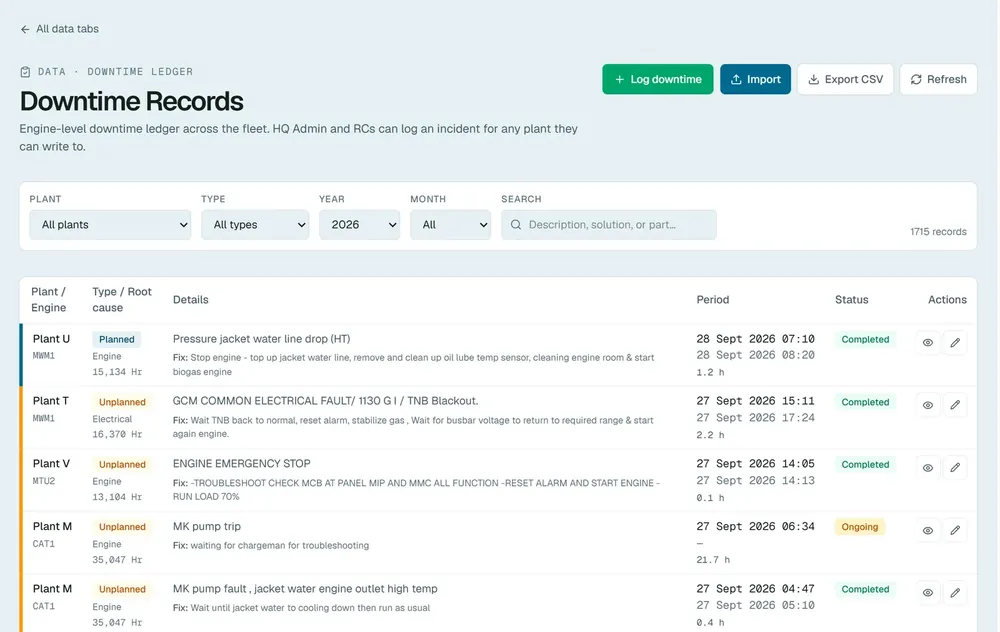
Downtime ledger
- Solution
- Engine-level outages with cause, fix, duration and running hours.
-
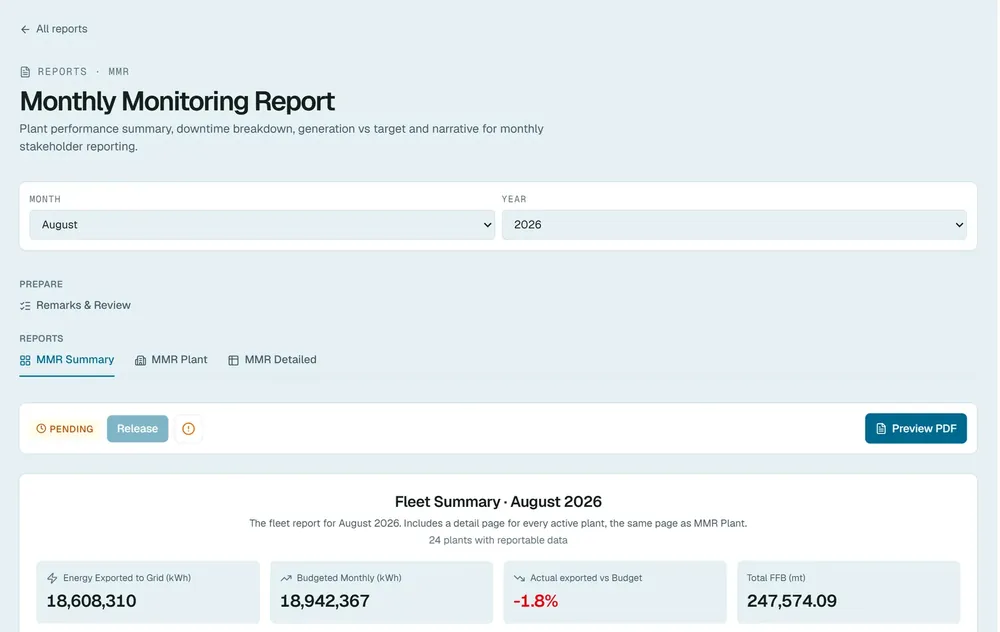
Monthly report
- Solution
- Built from logged data, reviewed, released and exported to PDF.
-
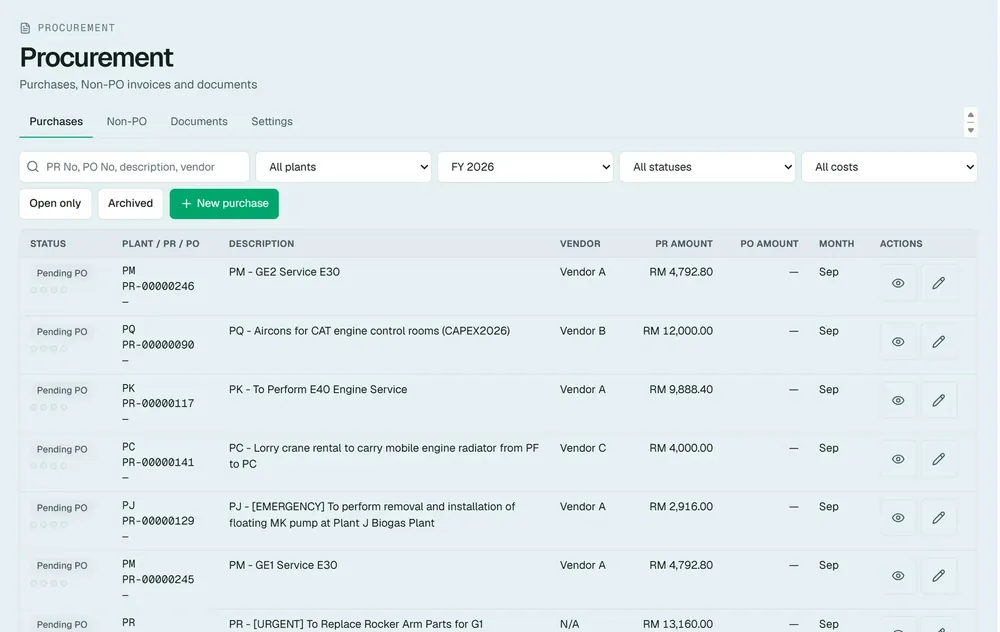
Procurement
- Solution
- Requests and orders per plant, with amounts, status and documents.
Engineering notes
Next.js and React over a MySQL fleet database, with scheduled jobs pulling SCADA data around the clock.
The platform includes a token-authenticated public API for downstream tools, push notifications for engine-down events, and blue-green deployments so updates never interrupt the operators' shift.