Every solar site, judged against the sun.
A monitoring and operations platform for 138 commercial solar sites that each report through a different inverter vendor. Every site is checked against modelled expected energy and an independent satellite twin, and every fault ends in a work order.
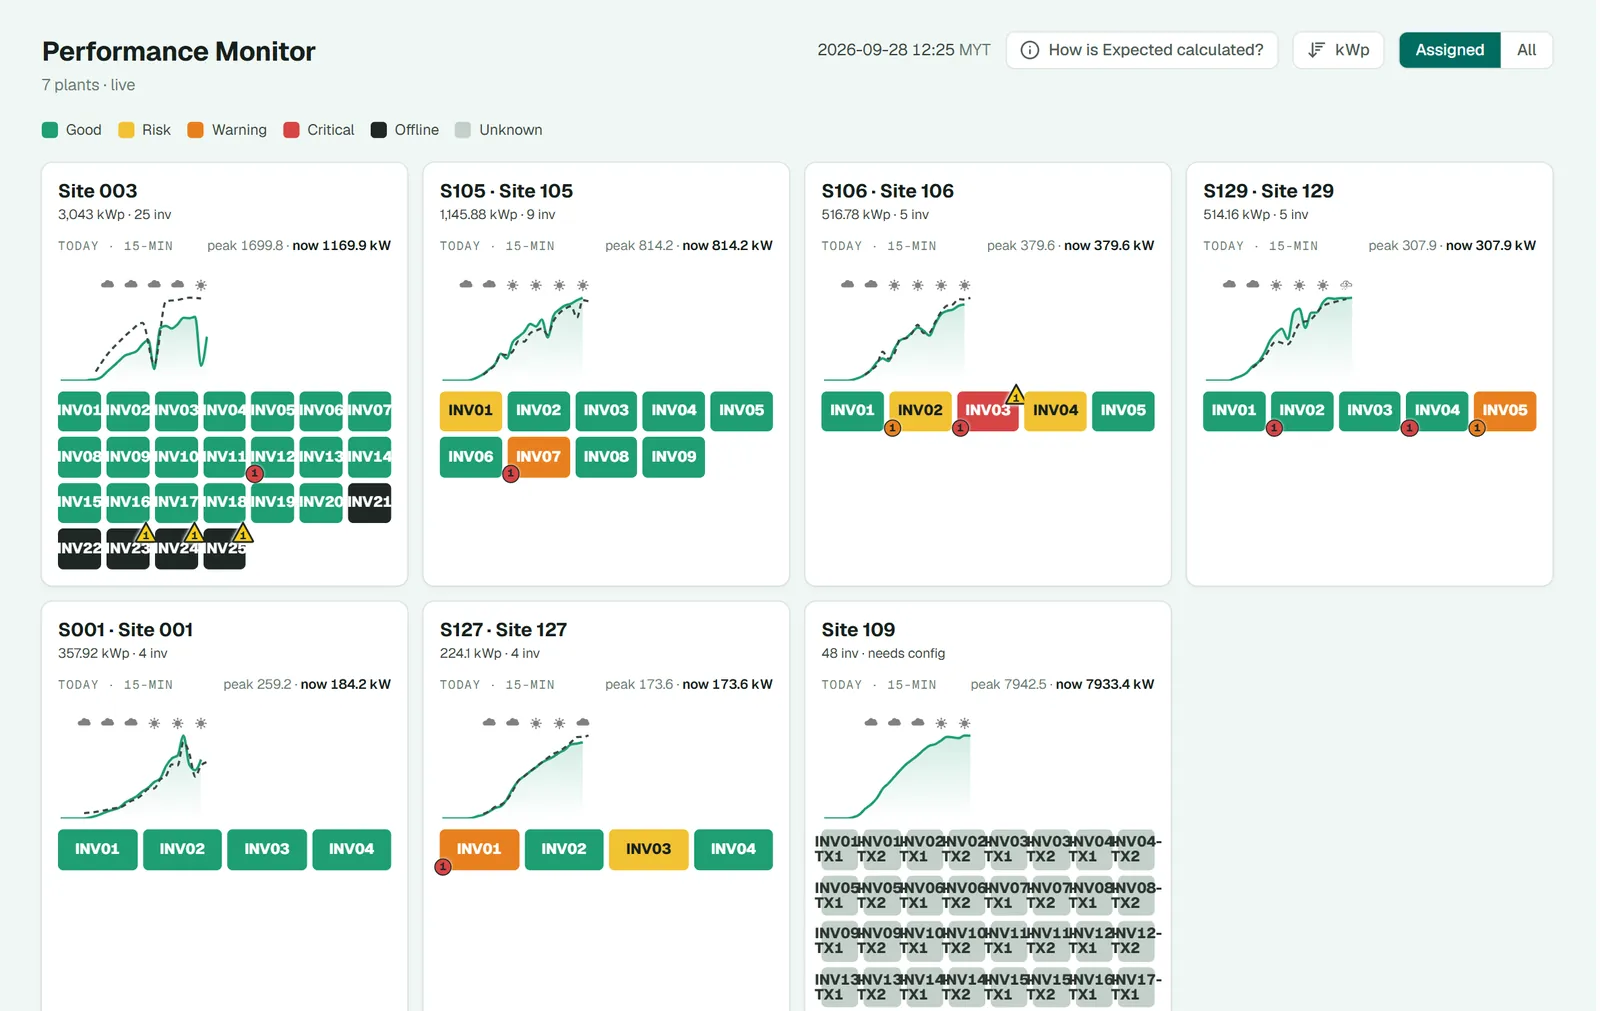
One vendor portal per inverter brand
Each site reported through its own inverter vendor's portal. A dead inverter could go unnoticed for days, and a cloudy day looked the same as a broken plant.
There was no expected-yield baseline, and field jobs were tracked in chat.
Measured against what the sun delivered
Every morning each site is compared with what it should have produced. When the gap opens, the alarm is already on the list, and one click turns it into a work order with an SLA.
Did each site produce what the sun delivered?
Expected energy is modelled from measured sunlight, checked per inverter, and cross-checked against a satellite twin. Swipe or use the arrows; the card in the middle explains its method. Real screens, site names masked.
-
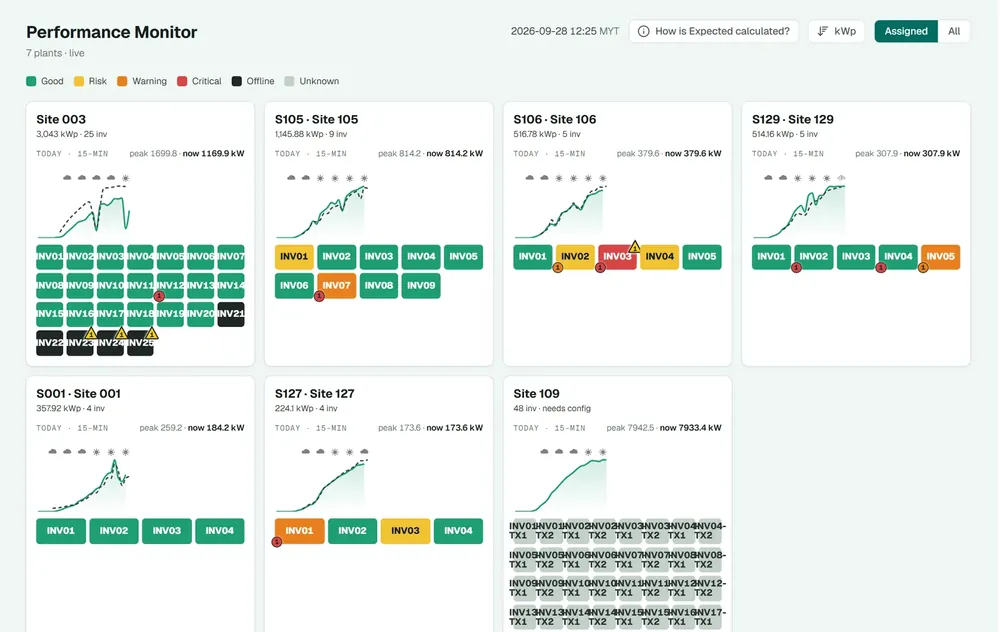
Live output against expected
- Method
- Live power against a modelled expected curve, inverter health bands
- Problem
- Each inverter brand has its own portal, so a dead inverter could go unnoticed for days.
- Solution
- Every site on one board with today's power against its expected curve, and one tile per inverter coloured by health.
-
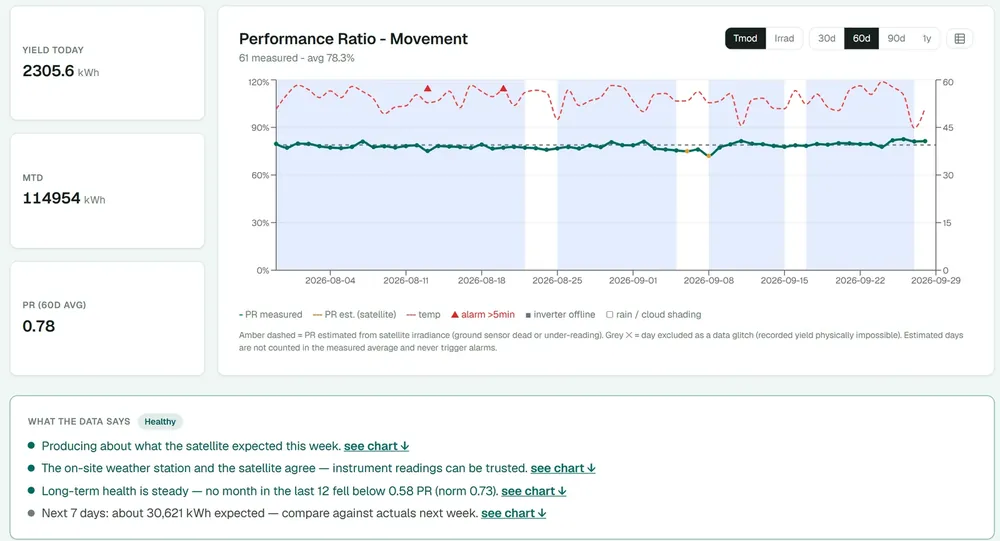
Performance ratio over time
- Method
- Temperature-corrected PR, satellite fallback on sensor failure, glitch-day exclusion, 7-day outlook
- Problem
- A monthly PR figure hid the week a site started to slip.
- Solution
- Daily PR with alarms and inverter outages on the same axis, plus a plain-language readout of what the data says.
-
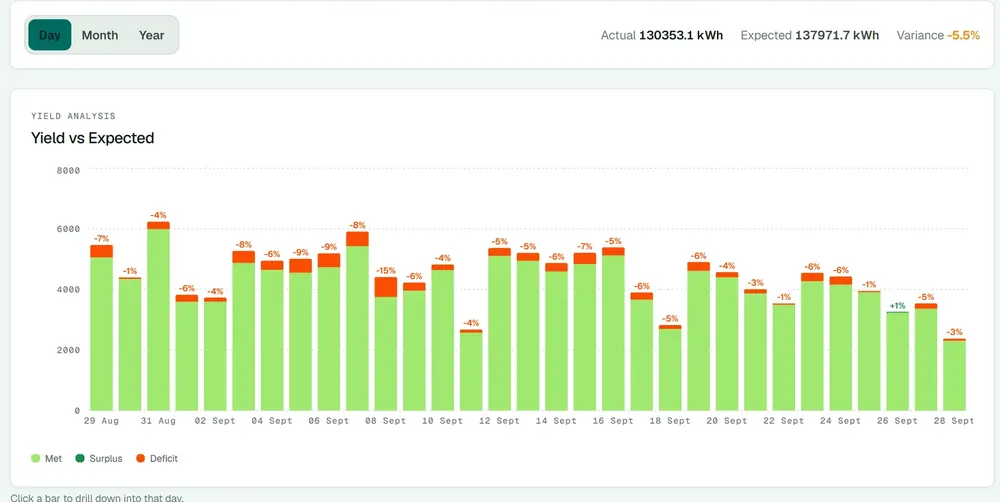
Yield against expected
- Method
- Expected energy modelled from measured irradiance and plant capacity, daily variance
- Problem
- Owners only saw kWh produced. A cloudy day and a broken plant looked the same.
- Solution
- Each day's yield against its expected value, with the shortfall in percent on every bar.
-
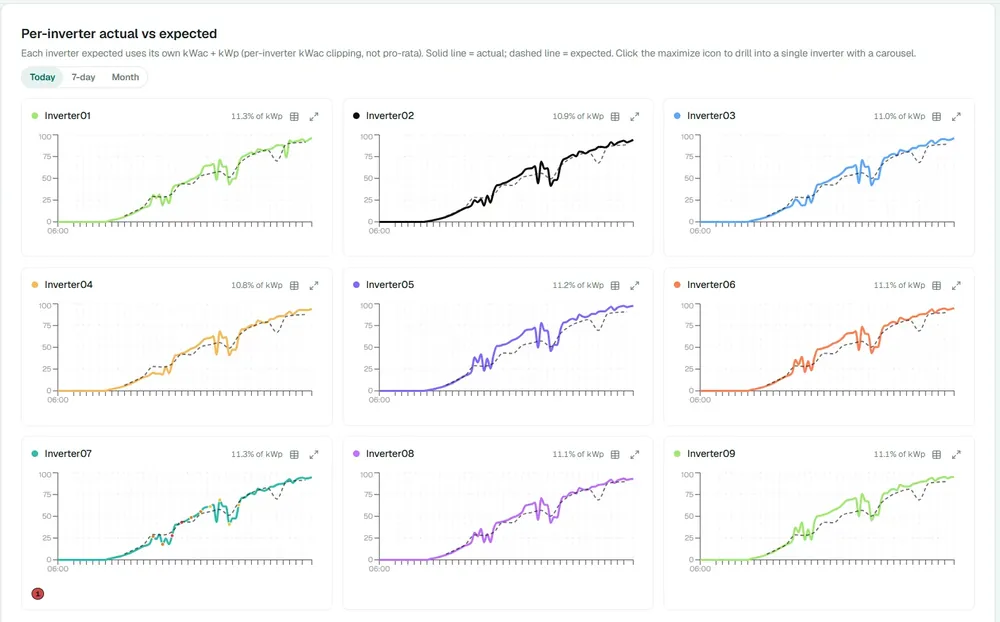
Expected, per inverter
- Method
- Per-inverter model using each unit's own kWac and kWp, with clipping
- Problem
- A site-level total hides one weak inverter among nine healthy ones.
- Solution
- Actual against expected for every inverter over today, 7 days or the month.
-
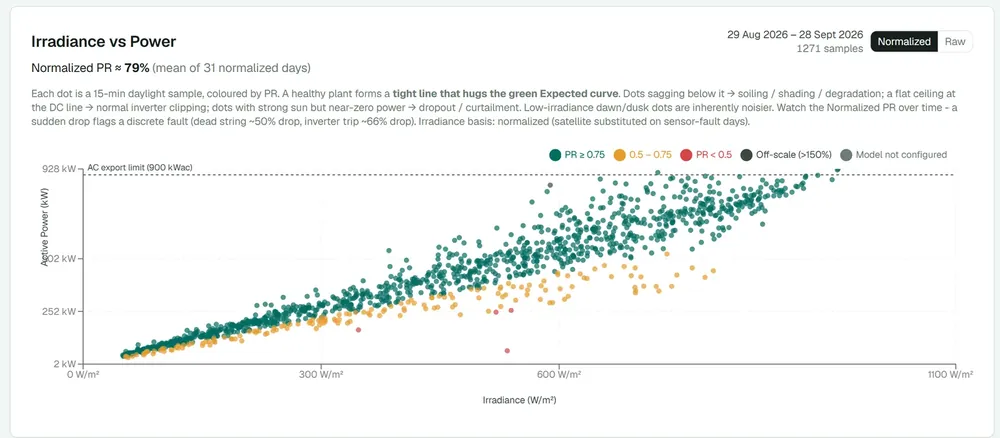
Sunlight against power
- Method
- Irradiance-power scatter on 15-minute samples, normalised PR
- Problem
- Soiling, shading and inverter clipping all hide inside a daily total.
- Solution
- Every sample plotted as sunlight against power. A healthy plant hugs the curve; faults fall below it.
-
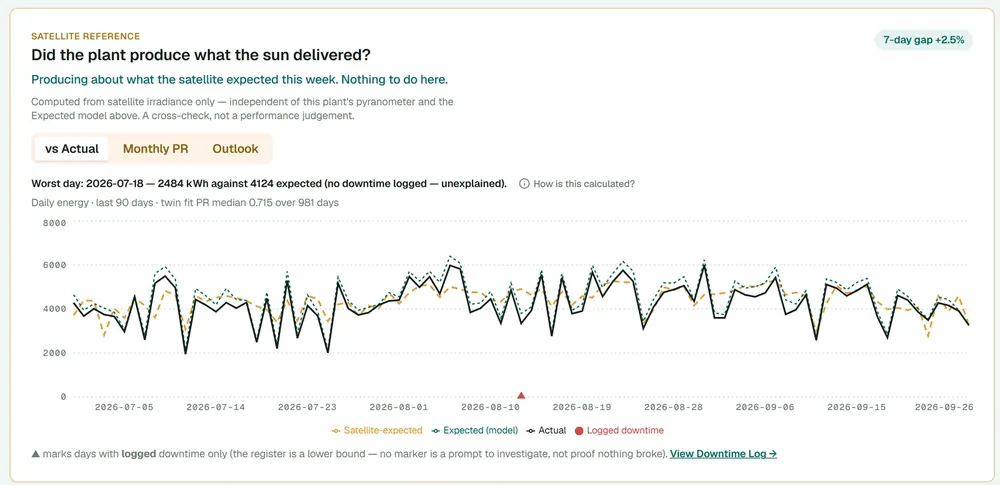
Satellite twin
- Method
- Independent model from satellite irradiance, fitted over 981 days, 7-day rolling gap
- Problem
- If a site's own sunlight sensor is dirty or dead, its expected value is wrong as well.
- Solution
- A second opinion built from satellite data alone: satellite-expected against actual energy, with a flag when the gap widens.
-
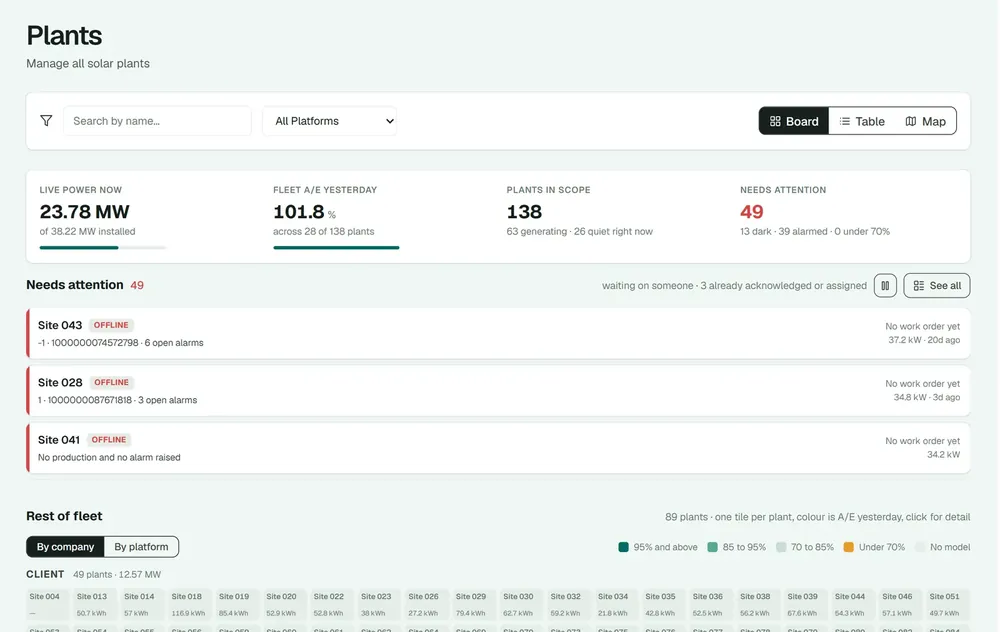
Fleet health at a glance
- Method
- Actual over expected (A/E) per site, ranked attention queue
- Problem
- With 138 sites, nobody knew which ones needed attention today.
- Solution
- Fleet KPIs, a ranked queue of sites that need action, and one tile per site coloured by yesterday's A/E.
-
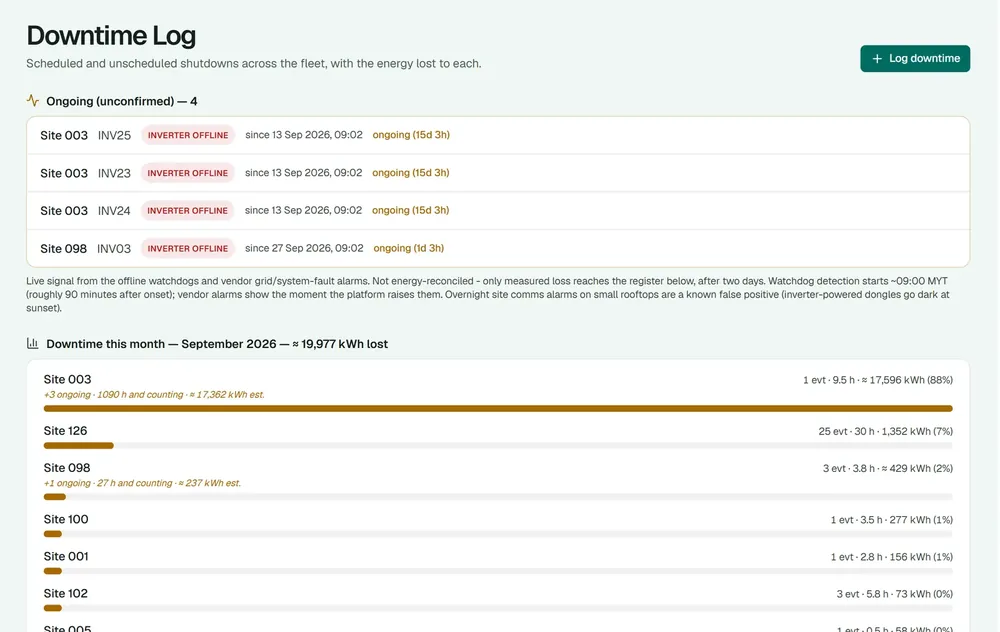
Energy lost to downtime
- Method
- Lost energy estimated per event, ranked by site
- Problem
- Energy lost to outages was never measured, so it was never priced.
- Solution
- Every shutdown logged with its estimated kWh lost, ranked by site for the month.
-
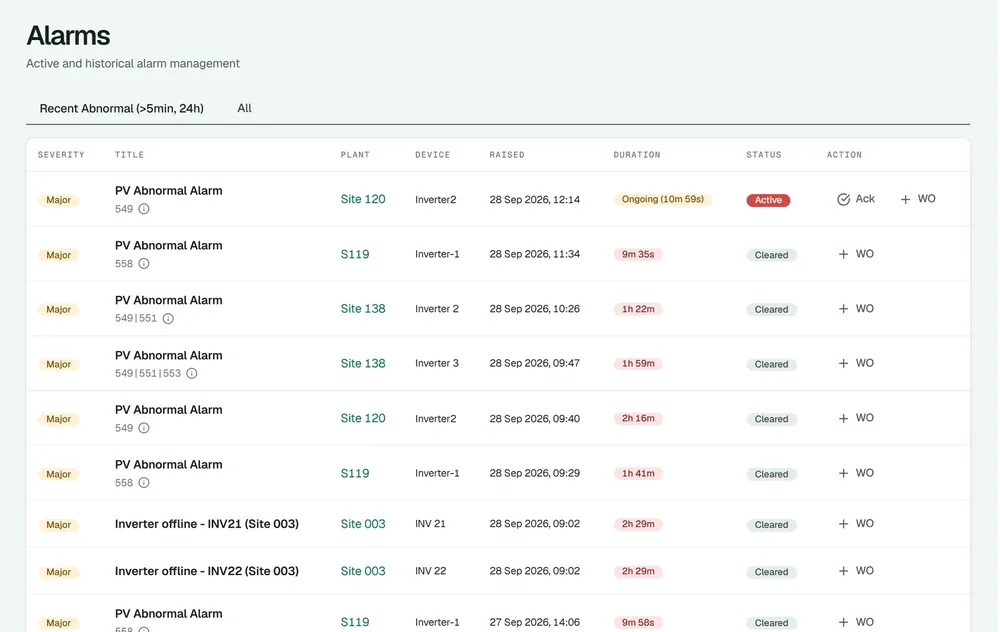
Alarms
- Solution
- Every vendor alarm in one list, one click to a work order.
-
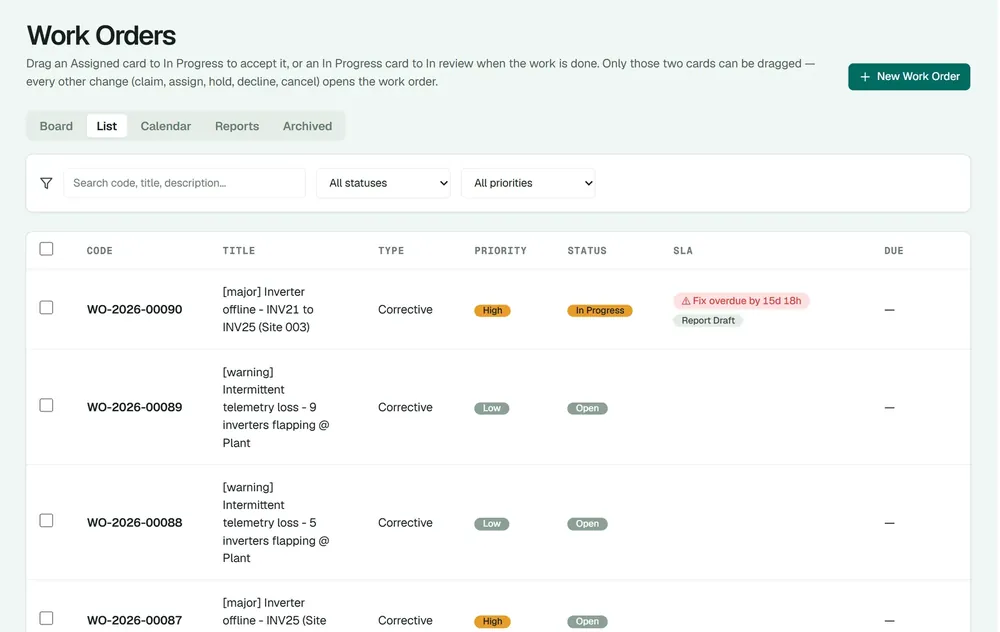
Work orders
- Solution
- Board, list and calendar views with priorities and SLA flags.
Engineering notes
A Next.js front end over a Hono and Prisma API, collecting inverter data from each vendor platform on a schedule.
Expected energy uses each inverter's own capacity and clipping limit, and the satellite twin is a separate model fitted on satellite irradiance so a failed site sensor cannot hide a fault.